

Twilio Co-Founder Jeff Lawson Acquires The Onion: Insights into the Controversial Deal and What it Means for the Future
Reports have emerged that Jeff Lawson, the co-founder of cloud computing company Twilio, has potentially purchased satirical news website The Onion from G/O Media. A trust linked to Lawson is…
1. “Revolutionizing Irritable Bowel Syndrome: A Newly Developed Product Uses Natural Medicinal Herbs and 5-HTP to Ease Symptoms and Promote Health
Trang Phuc Linh Plus, a product specifically designed for spastic colon disease or IBS, has been developed by Vietnamese scientists by combining the active ingredient 5-HTP with other medicinal herbs…
Sustainable Fabrics, Innovative Technologies and Collaborative Sustainability Discussion at the Functional Fabric Fair in Portland, Oregon
The Functional Fabric Fair, powered by PERFORMANCE DAYS, recently held a successful event in Portland, Oregon. The show took place on April 17-18 at the Oregon Convention Center and attracted…
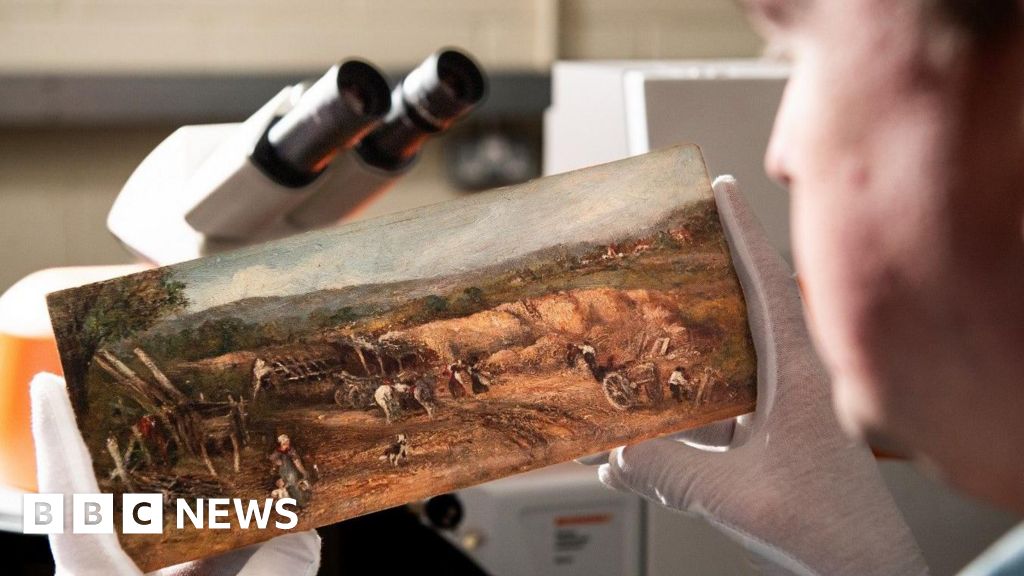
Cutting-Edge Science Sheds Light on Potential John Constable Masterpieces
John Constable, the celebrated 19th-century artist known for his stunning landscapes of the English countryside, may have created three additional works that have recently been uncovered. To determine the authenticity…
Alaska Sports Hall of Fame Inducts Multi-Sport Athlete Bobby Hill in 2024 – Promoting Health and Wellness in the Great Land
The Alaska Sports Hall of Fame is honoring Eagle River’s multi-sport athlete Bobby Hill as a member of its class of 2024. Harlow Robinson, the executive director of Healthy Futures…
Iowa educators Susan Wenger and Brenda Kaufmann named finalists for Presidential Awards in Mathematics and Science Teaching”.
Two exceptional Iowa educators, Susan Wenger and Brenda Kaufmann, have been named finalists for the Presidential Awards for Excellence in Mathematics and Science Teaching. Susan teaches at Valley Elementary School…
Uncovering the Genetics Behind Broccoli’s Bitterness: How to Make this Nutritious Vegetable More Palatable
Broccoli, a cabbage plant belonging to the genus Brassica, is known for its bitterness. This can be a turnoff for some people, but others love it. The reason for broccoli’s…
Comedy Meets Science: How Climate Scientists are Using Humor to Captivate the Public
Comedians are now being enlisted to help simplify complex scientific information and capture widespread attention as scientists face challenges in effectively communicating the urgency of the climate crisis to the…
Unraveling the South Korean Government’s Role in the Disastrous World Scout Jamboree: An Investigative Look at Safety, Security, and Coordination Challenges
The South Korean government has denied responsibility for the disastrous World Scout Jamboree last year, despite being blamed by investigators. Tens of thousands were evacuated from the campsite due to…
Montana WWII Veteran Receives Congressional Gold Medal for Bravery and Innovation
100-year-old World War II veteran, Dr. Maury Irvine, received the Congressional Gold Medal on Thursday. Born in San Francisco, Irvine moved to Montana and graduated from Butte High in 1941.…